
January 14, 2016
In this blog, we are taking a look at Road Safety Data published by the Department for Transport. For more information on the dataset and what it contains, please take a look here.
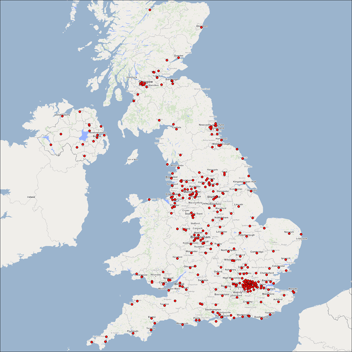
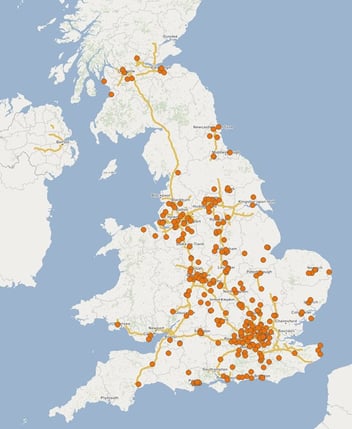
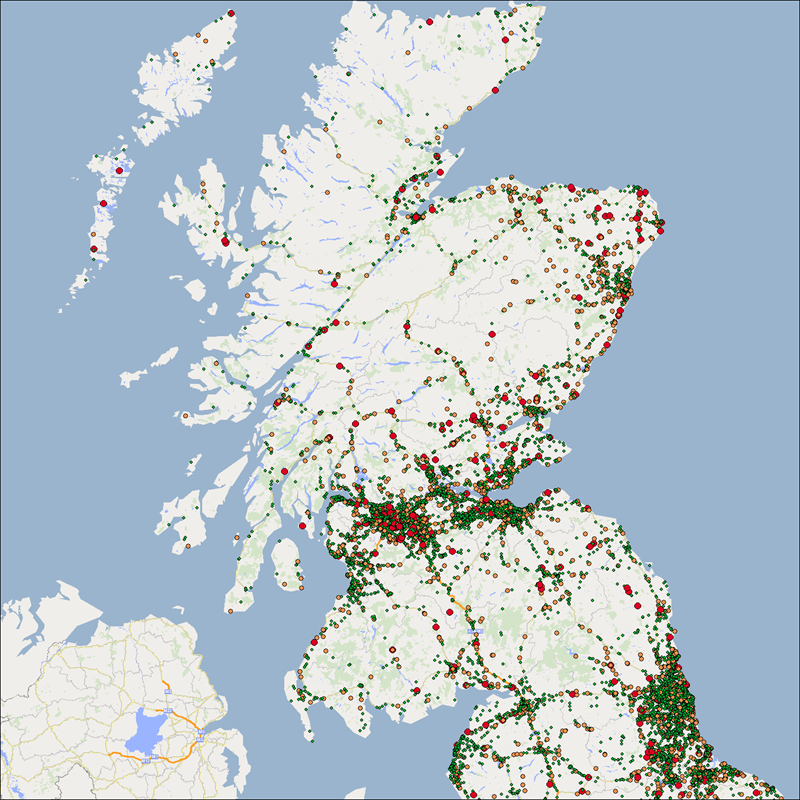
For the purpose of this article, we have used the Road Accident Data collected in 2014. This data shows where the road accidents took place and the severity of the accident. In the images throughout the article, green dots symbolise 'Slight' accidents, orange dots symbolise 'Serious' accidents and red dots symbolise 'Fatal' accidents.
Overall Statistics
- 146,322 road accidents recorded in 2014.
- 123,988 categorised as ‘Slight.'
- 20,676 categorised as ‘Serious.'
- 1,658 categorised as ‘Fatal.'
The North of the UK
The South of the UK
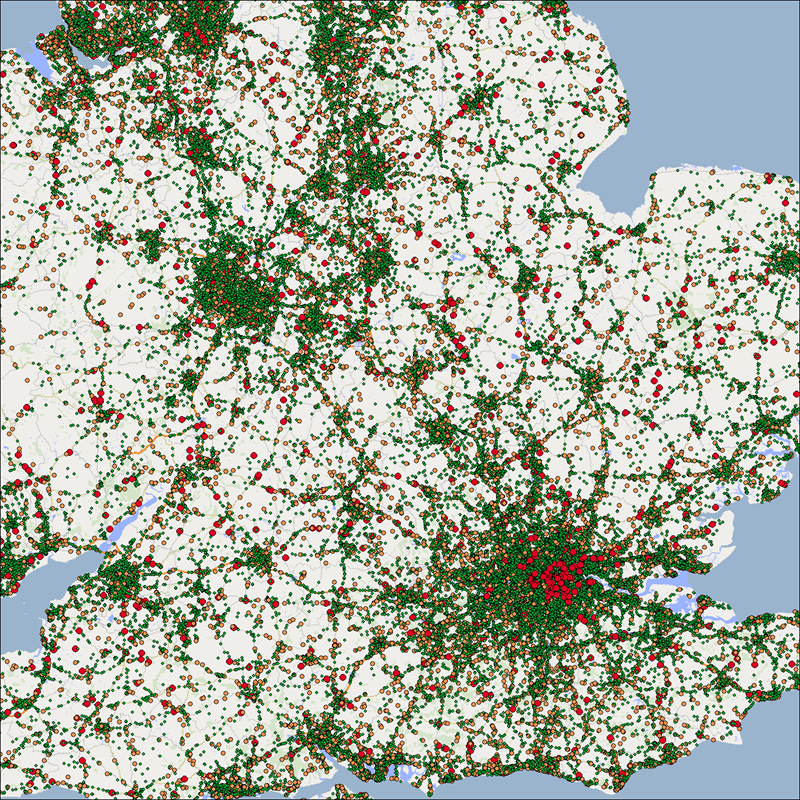
The two images show the spread, concentrations and accident severity of road accidents in the North and South of the UK. The images highlight that the vast majority of accidents occur in more urban areas such as towns and cities. However, you can also see that the accidents classified as 'Serious' or 'Fatal' tend to happen as you move away from the town and city centres and into the more rural areas. This makes sense when you think about the roads and speeds associated with these areas, as well as the emergency services ability to reach the location of the accident.
As you would expect, Greater London shows a hive of accidents throughout the city. With such high volumes of cars and traffic on the roads, plus the difficulty of the road infrastructure itself, it’s no surprise that so many incidents occur here.
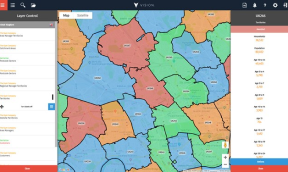
Regional Statistics
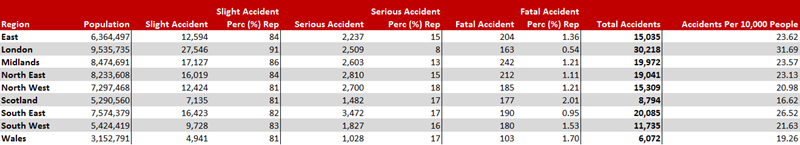
We’ve then taken a look at different regions and any noticeable variances. Accidents are more likely to occur in London and the South East region, however, these accidents also tend to be less severe.
Alternatively, in Scotland, you are less likely to have an accident, but when they do occur, they tend to be more serious.
Let’s take a closer look
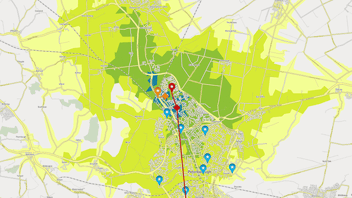
We’ve chosen to look at Peterborough as it’s where we’re based, so we have a better understanding of the roads here. The statistics for the area are below:
- 599 categorised as ‘Slight.'
- 88 categorised as ‘Serious.'
- 10 categorised as ‘Fatal.'
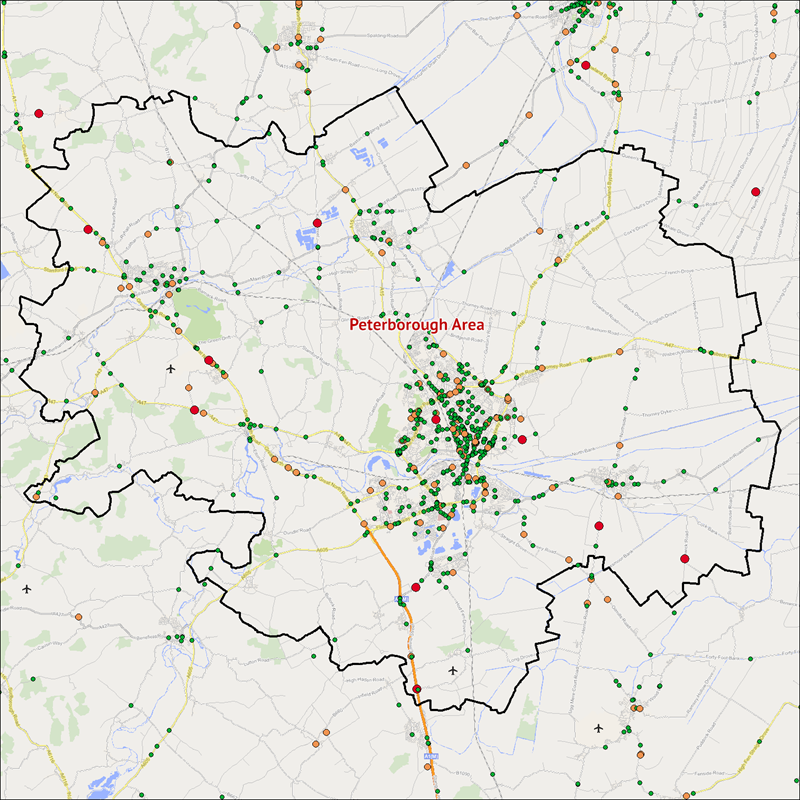
First off, as we move towards the city centre the number of traffic accidents increases, though they are only 'Slight' to 'Serious' in terms of severity. Also as we discussed earlier in the article, only one of the fatal accidents has occurred within the city, and all of the others took place outside in the more rural areas.
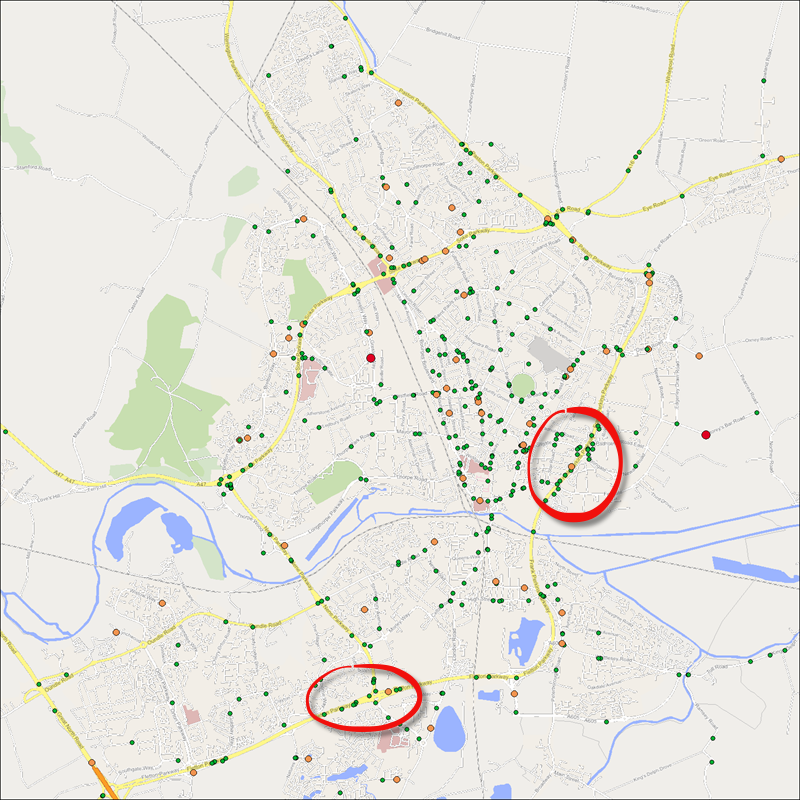
We can also see that certain areas throughout the city, well known for being accident prone, have clusters of points showing. We’ve zoomed in to show such examples, and in the main, it shows where slip roads join onto the parkways.
We hope you've found the article interesting and has provided you with some food for thought, if you have any ideas or data that you would like to see used in an up and coming blog, please get in touch.